The Warming Earth
 The other day I was perusing Phil Plait's Bad Astronomy blog when I happened upon this article on global warming. Naturally the denier myths were flying fast and furious. So as a public service a little of the science of climate change.
 The first climate change denier myth to be looked at is that the temperature "hockey stick" has been discredited (PlaitWeb , 2009, commenter #8) . Related to this are that the climate change data presented by the global warming side of the debate ends in 1998 (PlaitWeb , 2009, commenter #23) and that 1998 was the warmest year on record and has since cooled. I do this class of myth first since it is the easiest to debunk. From an instrumentation stand point there is reliable data going back to the early 1700's for the continental United States (NOAAWeb , 2009). Now the naysayers out there will complain that US data isn't the world, but no part of the planet is in isolation from any other for the atmosphere. This means that similar trends will be measured anywhere in the world regardless of the absolute temperature at a specific point on the planet. From the graph in Figure 1 which shows annual average temperatures for the US from 1700 to 2009 it can be readily seen that the general trend since 1850 is up, and that the average temperature past 2000 continues to increase to levels beyond those 1998.
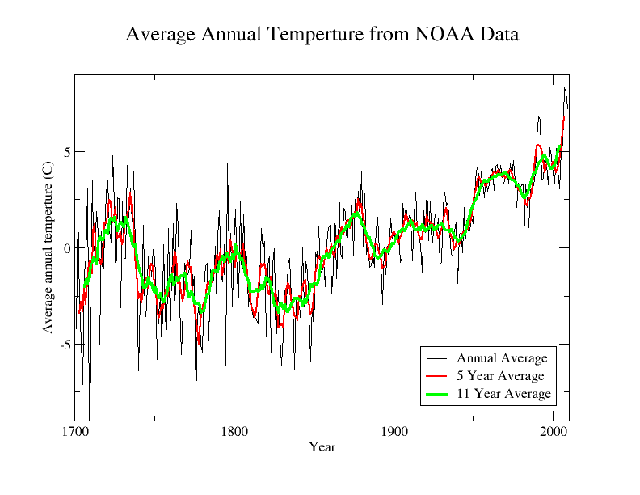
Figure 1
At this point I suspect that any climate change denier that has happened along will state that it may have been warmer before 1700. In fact much of the hockey stick dispute has been with data prior to that date since there are no direct instrumentation measurements for that time. For this proxy data has to be employed which causes errors in measurement of temperature to occur. General proxies used are things such as tree rings, ice cores and corals. The first and oft quoted paper on this Mann et al (1998) shows that the past 150 years or so has indeed been anomalously warm compared to the past 1000 years or so. Of course those on the climate change denier side have stated that Mann et al (1998) used improper data (refuted by (Mann et all , 2004)), or improper computer modeling or bad statistics which. Further study of the model by Ammann & Wahl (2007) shows that these critiques are unfounded. Ammann & Wahl (2007) show that the model used by Mann et al (1998) is quite robust for various temperature proxies and that the 1998 paper is valid. Further a newer study by Mann and his colleagues has used a larger set of proxies and has ended up with similar results(Mann et al , 2008). The upshot of all this is that yes, the Earth is warming to a point it has not seen in the past 1000 years and that the current warming trend started in roughly the early to mid 1800's. This means that the science is in and yes, the Earth is warming - period. Anyone denying this is in total ignorance of the science and the data.
Since it has been shown that the Earth is definitely warming that leaves us to determine the cause. Is the warming due to natural or anthropogenic reasons. The first thing we need to look at is where is the energy causing the warming coming from, as energy needs to be put into the system to cause an increase in temperature. For the Earth, the Sun is the source of energy. This means that variations in solar energy production should cause variations in the temperature here on Earth. The amount of solar energy of all wavelengths reaching the top of the Earth's atmosphere is known as the Total Solar Irradiance (TSI). As can be seen from Figure 2, that the TSI tracks the sunspot cycle (a proxy for solar activity) quite nicely (TSI data from the ERB satellite (NASAWeb , 2009), sunspot data from SIDCWeb (2008) ).
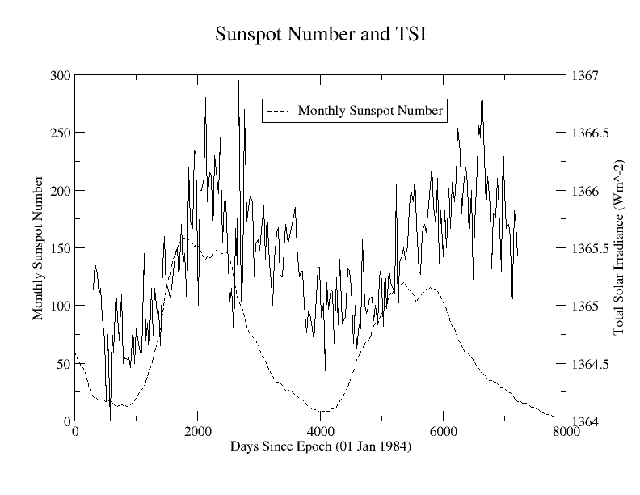
Figure 2
It is important to note that the average solar TSI for the period shown is 1365.4 Wm^-2 with a minimum of 1364.0 Wm^-2 and a maximum of 1367.0 Wm^-2 for a range of 3.0 Wm^-2. This gives a total amount of energy incident on the Earth at the top of the atmosphere being an average of 1.741x10^17W and the variance between minimum and maximum activity being 3.825x10^14W. This means that the difference in energy between minimum and maximum is only 0.2% of the average. To help visualize what 3.0 Wm^-2 looks like, it is the amount of energy you'll get from a 100W light bulb if you stand 1.6m ( about 5 feet) from it. So we expect to see the average temperature on the Earth go up and down in the same 11 year cycles as solar activity. Looking back at Figure 1 one can see that most of the rapid temperature rise and fall that causes the annual average temperature line to be so variable do indeed happen in around 11 year cycles. It also can be seen from the same graph that the variation from cycle bottom to top is about 2C.
Now we have accurate TSI data from 1978 to the present. This does not give us enough information to determine how much of the long term temperature increase is caused by an increase in solar activity. To this end solar astronomers have been looking at various proxies for TSI going back in history. At the moment solar magnetic activity is the proxy used. With this data, it has been estimated by Krivova et al (2007) that the increase in TSI since the end of the Maunder minimum at around 1700 is about 1.3 Wm^-2 . This is slightly lower than half the TSI range from sunspot minimum to maximum so we would expect that it would cause an increase of temperature in the Earth's atmosphere about half that caused by the 11 year solar cycle which works out to about 0.9C. As can been seen in Figure 1, the 11 year average temperature, which in effect eliminates the direct effect of the solar cycle, shows an increase of of around 3.6C, way more than what would be expected with the simple secular increase in solar activity. It is important to note at this point that the periods of cooling during the early part of the 1900's and around the 1950's is probably due to increased vulcanism causing large amounts of dust in the atmosphere (Alexeev , 2007). This dust increases the Earth's albedo which means more energy is reflected back into space, causing cooling.
So what does this all mean? Well it means that part of the increase of average temperature is due to an increase of energy from the Sun but there isn't enough of an energy increase to account for the temperature increase. This means that there is another mechanism causing the retention of energy in our atmosphere. Mann et al (1998) provide evidence that suggest that beginning around 1875, carbon dioxide became a larger factor in affecting surface temperature than TSI. Since nature hasn't increased production of carbon dioxide, but humanity has, this would imply that the increase in carbon dioxide in the atmosphere has a strong anthropogenic component. It boils down to the fact that yes, the Sun is warming the Earth up due to an increase in activity, but we are making the increase happen faster and larger than it would be by solar activity alone. This becomes more apparent in that over the past few years temperature has continued to climb despite the Sun entering sunspot minimum and reducing the TSI.
References:
Alexeev, V.A., 2007, Sol. Sys. Res., 41, 527
Ammann, C.M. & Wahl, E.R., 2007, Climatic Change, 85, 71
Krivova, N.A., Balmaceda, L., Solanki, S.K., 2007, A&A, 467, 335
NOAAWeb, 2009, Mean temperature data, ftp://ftp.ncdc.noaa.gov/pub/data/ghcn/v2/, file:v2.mean.Z (Accessed 01 December 2009)
Mann, M.E., Bradley, R.S., Hughes, M.K., 1998, Nature, 392, 779
Mann, M.E., Bradley, R.S., Hughes, M.K., 2004, Nature, 430, 105
Mann, M.E., Zhang, Z., Hughes, M.K., Bradley, R.S., Miller, S.K., Rutherford, S., Ni, F., 2008, PNAS, 105, 13252
NASAWeb, 2009, Atmospheric Science Data Center, http://eosweb.larc.nasa.gov/HORDERBIN/HTML_Start.cgi (Accessed 01 December 2009)
PlaitWeb, 2009, Bad Astronomy - The global warming emails non-event, http://blogs.discovermagazine.com/badastronomy/2009/11/30/the-global-warming-emails-non-event/#comments (Accessed 01 December 2009)
SIDCWeb, 2008, Solar Influence Data Centre, http://sidc.oma.be/sunspot-data/ (Accessed 09 September 2008)